China Top 10 Guide: How to Couple AC and DC Solar Systems? This question matters as solar markets become larger and more flexible. The IEA PVPS Trends 2024 report estimates that global photovoltaic capacity exceeded 1.6 terawatts by the end of 2023. China contributed a remarkable share of new installations. The National Energy Administration also reported more than 600 gigawatts of cumulative solar capacity in China during 2023.
This guide explains how to couple AC and DC solar systems in practical terms. AC coupling connects a conventional solar inverter with a separate battery inverter. DC coupling sends solar power directly into a hybrid inverter or charge controller before conversion. The correct choice depends on battery voltage, inverter compatibility, backup requirements, wiring distance, and future expansion plans. Small details matter. A short cable can reduce losses. An oversized inverter can waste money.
NREL researcher Paul Denholm has described the principle plainly: “Storage can shift solar energy to when it is most valuable.” That idea supports both coupling methods, but neither method is automatically superior. The NREL Storage Futures Study highlights the importance of system design, operating strategy, and grid conditions. No design is perfect. A clean diagram may still hide conversion losses, protection gaps, or poor battery scheduling. This China-focused guide compares leading approaches, explains common connection layouts, and identifies mistakes that installers should reconsider before commissioning a system. Read the specifications carefully. Real performance begins with compatibility, not appearance.
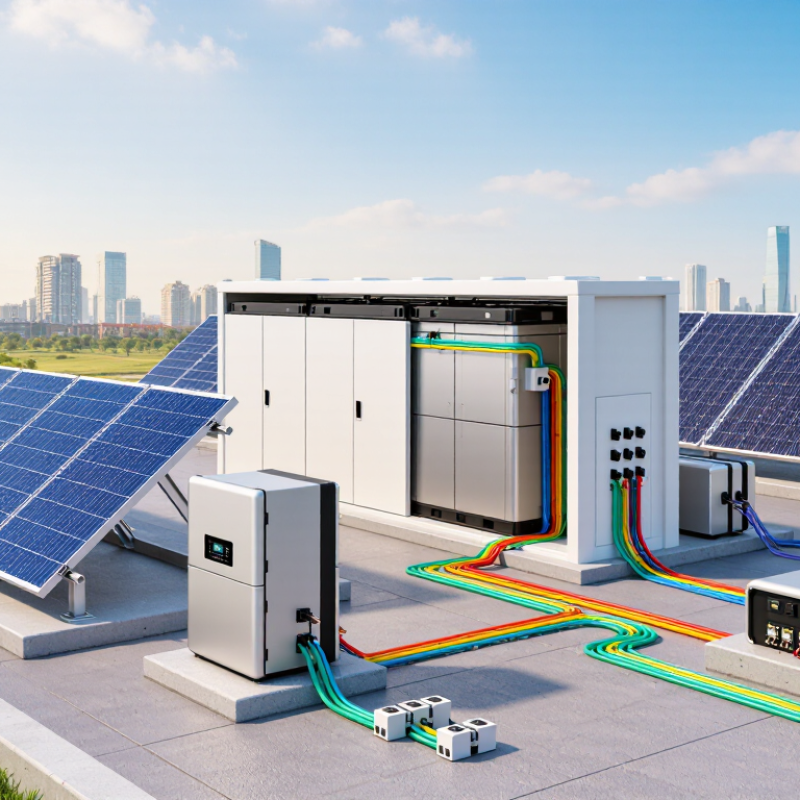
AC- and DC-coupled systems use different power paths. An AC-coupled design converts solar DC into AC, then converts it again for battery charging. A DC-coupled design connects solar and batteries through a shared hybrid inverter. This can reduce conversion stages, especially during direct solar charging.
Efficiency claims need careful reading. NREL’s PVWatts technical documentation uses 96% as a default inverter efficiency. Public data from the California Energy Commission shows many tested inverters near 96–99% weighted efficiency. These figures are not complete system efficiency. At 96% per conversion, two conversion steps retain about 92% before battery losses. The real result changes with temperature, load, wiring, clipping, and standby consumption. The number is not everything. A larger battery may also operate below its ideal power range, creating avoidable losses.
Tips: Choose DC coupling for new solar-plus-storage projects when battery charging is frequent. Consider AC coupling for existing solar arrays, separate roof orientations, or easier system expansion. Check weighted efficiency, round-trip battery efficiency, and low-load performance together. Ask for measured operating data, not only a headline “99%” figure. This is where many comparisons become too simple.
Coupling AC and DC solar systems begins with a clear load profile. Record daytime demand, evening consumption, peak loads, and seasonal changes. A 1.2–1.5 DC/AC ratio usually provides a practical starting point. For a 10 kW AC inverter, the PV array may range from 12 to 15 kW DC. This extra capacity improves morning and winter production. It also accepts some midday clipping.
Clipping is not automatically a design failure. In many projects, the lost peak energy costs less than adding another inverter. However, roof orientation, local irradiance, temperature, and grid limits can change the result. A south-facing array may clip more than a split east-west array. Check hourly simulations, not only annual yield. Real measurements matter.
Battery sizing should follow the usable energy requirement, not the PV panel count. If evening loads need 18 kWh, a battery may require more than 18 kWh nominal capacity after depth-of-discharge and conversion losses. Power rating also matters. A battery with enough energy may still fail to start a pump or support several appliances together. DC-coupled batteries can reduce conversion steps during solar charging. AC coupling can simplify expansion and retrofit work, but repeated conversions reduce efficiency. I have seen early designs oversize batteries while overlooking inverter surge power. That mistake deserves review. Weather data and actual utility rules should be checked before final equipment selection.
China Top 10 Guide: How to Couple AC and DC Solar Systems?
Solar capacity is expanding rapidly. IRENA reported 452 GW of new solar capacity worldwide in 2024, making interface safety increasingly important (Renewable Capacity Statistics 2025). In an AC-coupled system, the battery inverter connects beside the PV inverter on the AC bus. In a DC-coupled system, PV and batteries share a hybrid conversion stage. This can reduce conversion losses, but control becomes less forgiving.
Protection should follow IEC 62109-1 and IEC 62109-2 for power-converter safety. Check insulation, touch protection, temperature rise, clearances, and fault shutdown. Add correctly rated DC fuses, disconnectors, surge protection, and visible isolation points. Do not select devices only by nominal voltage. Short-circuit current and maximum continuous current matter more during faults. A small mistake here can become expensive.
GB/T 34120 provides technical requirements for electrochemical energy-storage power conversion systems in China. The grid interface should verify voltage range, frequency response, power quality, anti-islanding behavior, and communication signals. The protection settings must match the utility connection agreement, not a copied template. IEA PVPS has repeatedly identified grid integration and storage control as practical deployment challenges (Trends in Photovoltaic Applications 2024). Field commissioning should test import, export, black-start limits, and emergency shutdown. Some projects still test only normal operation. That is not enough.
Representative electrical interfaces for AC-coupled and DC-coupled solar systems. The AC waveform uses a 230 V RMS, 50 Hz single-phase reference, equivalent to approximately 325 V peak. The DC link is shown at a representative 400 V level commonly used in power-conversion architectures.
IEC 62109 focuses on safety requirements for power converters used in photovoltaic systems, while GB/T 34120 addresses technical requirements for power conversion systems used with electrochemical energy storage. Actual voltage, current, isolation, overcurrent protection, anti-islanding, and grid-interface settings must be verified against the applicable system design and local grid code.
China Top 10 Guide: How to Couple AC and DC Solar Systems?
Trace Power Flow and Round-Trip Storage Efficiency at 85–95%
AC-coupled systems place the battery inverter beside the solar inverter. Solar power first becomes AC, then returns to DC before storage. During discharge, it converts back to AC. This path is simple to retrofit, but every conversion consumes energy. The U.S. Department of Energy’s Energy Storage Technology and Cost Characterization Report identifies lithium-ion storage efficiencies commonly within the 85–95% range, depending on equipment and operating conditions.
DC coupling connects solar panels and batteries on the DC side. A shared inverter can reduce conversion steps, especially when solar energy charges the battery directly. Picture a 10 kWh midday surplus. At 90% round-trip efficiency, roughly 9 kWh reaches the load later. Cable losses, standby consumption, temperature, and partial-load operation reduce that result. Real sites rarely match laboratory figures.
NREL’s Annual Technology Baseline uses approximately 85% round-trip efficiency for representative battery-storage modeling, showing why system boundaries matter. Measure energy at the solar array, battery terminals, inverter output, and load meter. This power-flow map reveals whether losses occur during charging, storage, or discharge. Field testing may expose an uncomfortable gap between rated and delivered efficiency. That gap deserves attention.
China Top 10 Guide: How to Couple AC and DC Solar Systems?
Coupling AC and DC solar systems requires more than matching inverter ratings. Commissioning teams should verify string polarity, insulation resistance, connector torque, protection settings, and battery operating limits. They should also test export control, charge priority, curtailment, and recovery after a communications failure. The IEA PVPS Task 13 reports typical photovoltaic degradation near 0.5% annually, making long-term performance checks essential. A 97% availability target is practical, but only when downtime is measured consistently. Define availability clearly: planned maintenance, grid outages, and communication losses must not be hidden inside one number.
Controls need evidence, not assumptions. Compare meter data, inverter data, and the site controller at five-minute intervals. Check whether the DC system charges during excess solar, while the AC system responds correctly to grid instructions. The U.S. Department of Energy’s PV O&M best-practice guidance recommends structured inspections, alarm tracking, and performance ratio analysis. Still, a perfect dashboard can conceal a faulty sensor. This happens. Review daily energy curves, nighttime auxiliary loads, repeated trips, and inverter restart times. A 97% result is weak if the calculation excludes difficult hours.
Tips: Record baseline readings during commissioning. Photograph cable routes and torque marks. Test loss of communications under controlled conditions. Set alarms for abnormal clipping and battery temperature. Recheck the model after the first 90 days; field behavior may challenge the original design.
A 1.2–1.5 ratio is often practical. For a 10 kW AC inverter, consider 12–15 kW of PV capacity. This can improve morning and winter production. Some midday clipping is acceptable.
No. Clipping may cost less than adding another inverter. However, roof direction, sunlight, temperature, and grid limits affect the result. A south-facing array may clip more than an east-west layout. Use hourly simulations, not annual totals alone.
Size it around usable evening energy, not panel capacity. If evening loads need 18 kWh, nominal capacity must be higher. Depth-of-discharge limits and conversion losses reduce usable energy. The exact margin needs review.
Energy capacity alone may not start a pump. It may also fail when several appliances start together. Check continuous output and short surge power. This detail is easy to overlook.
DC coupling can reduce conversion steps during solar charging. AC coupling often simplifies retrofits and future expansion. Repeated conversions may reduce efficiency. The better choice depends on the site.
They should verify string polarity and insulation resistance. They should check connector torque and protection settings. Battery operating limits also require testing. Photograph cable routes and torque marks.
Test export control, charge priority, curtailment, and recovery functions. Compare meter, inverter, and controller data every five minutes. Test communication loss under controlled conditions. Dashboards can still hide faulty sensors.
Define availability before collecting performance data. Separate planned maintenance, grid outages, and communication failures. Track alarms, repeated trips, restart times, and nighttime auxiliary loads. A high percentage can mislead. Review the calculation carefully.
Recheck it after the first 90 days of operation. Compare expected and measured daily energy curves. Inspect battery temperature, clipping, and seasonal behavior. Field results may challenge the original design.
This guide explains how to couple AC and DC solar systems by comparing their power paths, conversion stages, and practical applications. AC-coupled systems are flexible for retrofits and separate generation from storage, while DC-coupled systems can reduce conversion losses by connecting solar arrays and batteries on the DC side. With inverter efficiencies commonly reaching 96–99%, system designers should coordinate PV capacity, battery storage, and inverter ratings, typically using a DC/AC ratio of 1.2–1.5 to balance energy yield, clipping, and equipment limits.
The article also outlines how to select protection devices and grid interfaces in line with IEC 62109 and GB/T 34120, trace energy flow from generation to consumption, and evaluate round-trip storage efficiency, often within an 85–95% range. Proper commissioning should verify controls, operating modes, safety functions, communications, and backup performance. Ongoing monitoring and maintenance are essential for achieving reliable operation and a target availability of approximately 97%.

Jonas Energy